
LoadRunner: What It Does Well and Where Mobile Teams Outgrow It
LoadRunner simulates virtual users to find where a system degrades under load. Its components, the vocabulary it established, and the client-side half it leaves out.
Yuvan Sundrani · 9 min read
autosana.ai

TL;DR
- LoadRunner is a long-established performance testing suite that simulates thousands of virtual users against a system to find where it degrades under load.
- Its strength is protocol breadth: it drives dozens of protocols beyond HTTP, which is why enterprise systems with legacy interfaces still rely on it.
- LoadRunner measures server-side capacity. It says little about what a user holding a phone experiences, which is a different measurement requiring real devices.
- Autosana covers the client side, measuring startup time, frame rendering, and network behaviour on real hardware while a load tool exercises the backend.
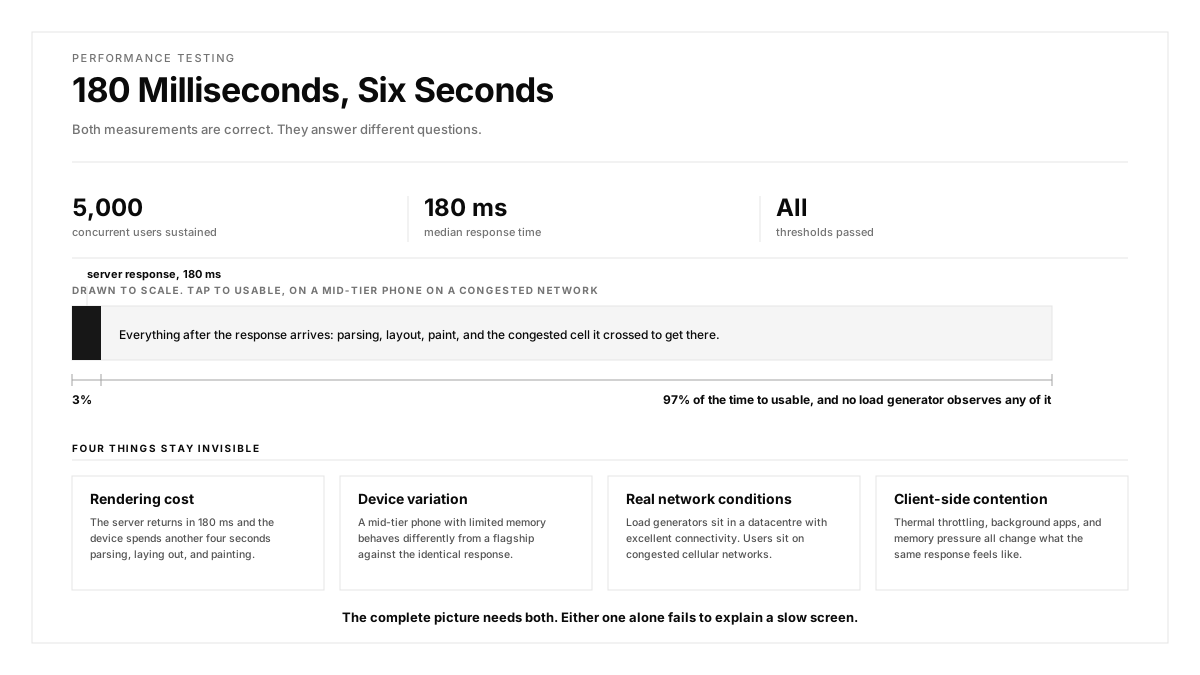
A backend sustains 5,000 concurrent users with a median response time of 180 milliseconds. Every LoadRunner threshold passes. On a mid-tier Android phone on a congested network, the same screen takes six seconds to become usable.
Both measurements are correct and they answer different questions. Load testing tells you when the server degrades. It tells you very little about what the person holding the device sees.
This guide covers what LoadRunner does, the vocabulary LoadRunner introduced that the whole field now uses, where it fits in a modern stack, and which part of the performance picture it structurally leaves out.
Google's DevOps research treats performance verification as a delivery capability rather than a late-stage gate, and the web.dev performance guidance supplies the client-side thresholds this guide refers to.
What LoadRunner Is
LoadRunner is a performance and load testing suite, originally from Mercury Interactive, now part of OpenText after passing through HP and Micro Focus. It has been in continuous use since the 1990s, which explains both its protocol coverage and its reputation for complexity.
Three components define how it works.
The Virtual User Generator records a business process and produces a script representing one user performing it. Scripts are parameterised so each virtual user runs with different data.
The Controller orchestrates a test: how many virtual users, how fast they ramp up, how long they sustain, and from which load generators.
The Analysis component correlates results against server-side monitoring, so a response time spike can be lined up against CPU, memory, or database metrics from the same moment.
That third piece is the part teams underrate. Producing load is straightforward; attributing a slowdown to a specific resource is the hard part, and it is what the tool was built for.
Which Performance Testing Terms Came From LoadRunner?
Much of the standard performance testing vocabulary came from the LoadRunner lineage and is worth being precise about.
Virtual users, or VUsers, are simulated concurrent users. Licensing has historically been priced on this number, which shapes how teams design tests.
Think time is the pause a script inserts to mimic a human reading a page. Removing it produces an unrealistically aggressive test; leaving it unmodelled produces a test that resembles real traffic poorly.
Ramp-up is how quickly virtual users are added. A system that survives a gradual ramp can still fall over under a sudden spike, and testing only the gradual case hides that.
Correlation is capturing a dynamic value from one server response and replaying it in the next request. Session tokens, CSRF values, and view state all need this. It is the single largest source of effort in script maintenance, because a changed response format breaks every script depending on it.
Pacing controls how often an iteration repeats, which is what converts a virtual user count into a transaction rate.
Those five terms transfer to every tool in the category, which is part of why the product remains a useful reference point even for teams using something else.
What Are the Four Types of Load Test?
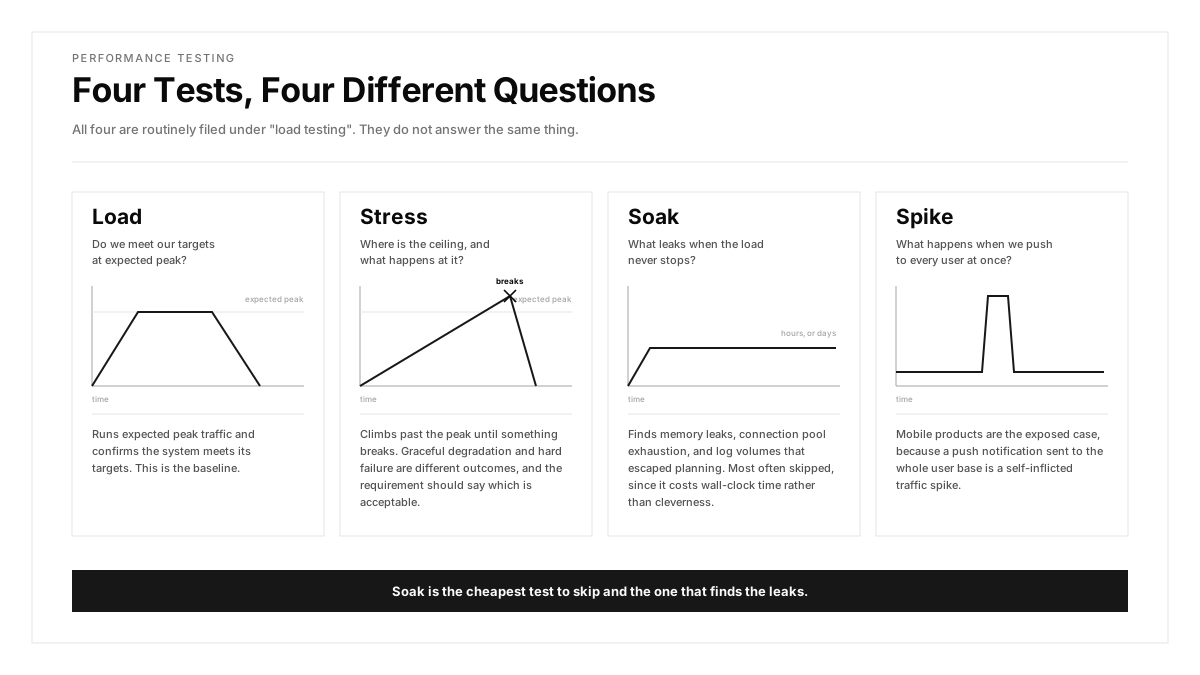
LoadRunner supports four distinct test shapes, often conflated under "load testing".
Load testing runs expected peak traffic and confirms the system meets its targets. This is the baseline.
Stress testing increases load past the expected peak until something breaks, to find where the ceiling is and how the system behaves at it. Graceful degradation and hard failure are different outcomes and the requirement should state which is acceptable.
Soak testing sustains moderate load for hours or days. This is the one that finds memory leaks, connection pool exhaustion, and log volumes that escaped planning. It is also the one most often skipped, since it costs wall-clock time rather than cleverness.
Spike testing applies a sudden sharp increase, modelling a marketing campaign or a push notification sent to the whole user base. Mobile products are particularly exposed here, because a push notification is a self-inflicted traffic spike.
Where It Fits Now
The category has broadened considerably since LoadRunner defined it, and the honest assessment is about fit rather than quality.
LoadRunner remains strong where protocol breadth matters: SAP, Citrix, mainframe terminal emulation, and other interfaces that web-focused tools skip entirely. Where your system speaks something unusual, the alternatives thin out fast.
LoadRunner is heavier than modern teams usually want for ordinary HTTP work. Licensing on virtual user count, a Windows-centric authoring experience, and scripts that live outside the application repository all sit awkwardly beside a pipeline-first workflow.
Our comparison of load testing tools covers the current field. The deciding questions are usually protocol coverage, whether scripts can live in version control beside the code, and whether a run can be triggered from CI rather than from a desktop controller.
What Load Testing Leaves Out
This is the part that matters most for a mobile team, and it is structural rather than a shortcoming of any particular tool.
A LoadRunner test, like any load test, exercises the server. It sends protocol-level requests from load generators, which means it measures server capacity, throughput, and backend latency accurately, while leaving client-side experience entirely unmeasured.
Four things stay invisible.
Rendering cost. The server returns in 180 milliseconds and the device spends another four seconds parsing, laying out, and painting. No load generator observes that.
Device variation. A mid-tier phone with limited memory behaves differently from a flagship against the identical response.
Real network conditions. Load generators usually sit in a datacentre with excellent connectivity. Users sit on congested cellular networks.
Client-side resource contention. Thermal throttling, background apps, and memory pressure all change what the same response feels like.
The complete picture needs both measurements. Mobile app performance testing on real devices covers the client half, and the two together explain a slow screen in a way either one alone fails to.
How Should Load Testing and Device Testing Be Combined?
The useful arrangement is sequential rather than parallel.
Establish backend capacity first with LoadRunner or an equivalent, so you know the server's limits and the response times it delivers at expected peak.
Then measure the client under those conditions. Run your device-level checks while the backend sits under realistic load rather than idle, since a response arriving in 180 milliseconds at peak differs from one arriving in 40 milliseconds on an empty system.
Then check the combination at the edges. A spike test on the backend paired with client measurement on a mid-tier device tells you what a push notification campaign actually does to your users.
API testing sits between the two, verifying that responses stay correct under load rather than merely fast, which is a failure mode load tools report poorly. Regression testing of performance thresholds then keeps the result from drifting release to release, and mobile test automation across the device matrix is what makes that measurement repeatable.
How Autosana Fits
We cover the client half of the picture, and we expect LoadRunner or an equivalent to cover the server half.
Our performance monitoring captures startup time, frame rendering, and crash-free sessions during runs on real iOS and Android hardware, which is the measurement a load generator structurally cannot produce.
Our network traffic inspection records request counts, payload sizes, and timing as the device experiences them, rather than as the server reports them.
Environments configuration sets the network profile and backend target per run, so client measurements can be taken against a backend under load rather than an idle one.
We organise these into suites that run on a schedule, and execution happens on real devices across the hardware tiers your users actually hold.
Conclusion
Take your most important screen and write down two numbers: the server response time at expected peak, and the time from tap to usable on a mid-tier phone.
Where the second is several times the first, the gap is client-side work that LoadRunner has been reporting as healthy all along. Android's startup time guidance sets the thresholds worth holding it to. That gap is where most perceived slowness lives, and it is invisible to any tool measuring from a datacentre.
Then check whether you have ever run a soak test. It is the cheapest test to skip and the one that finds the leaks.
.png)
FAQ
What is LoadRunner?
LoadRunner is a performance and load testing suite that simulates large numbers of virtual users against a system to find where it degrades. It originated with Mercury Interactive and is now an OpenText product.
What are the main LoadRunner components?
The Virtual User Generator records a process and produces a parameterised script. The Controller orchestrates virtual user counts, ramp-up, and duration. The Analysis component correlates results against server-side resource metrics.
What is correlation in load testing?
Capturing a dynamic value from one server response and replaying it in the next request, such as a session token or CSRF value. It is the largest ongoing source of script maintenance effort.
What is think time and why does it matter?
The pause a script inserts to mimic a human reading a page. Removing it produces an unrealistically aggressive test, while leaving it unmodelled produces traffic that resembles real usage poorly.
What is the difference between load, stress, soak, and spike testing?
Load runs expected peak. Stress pushes past it to find the ceiling. Soak sustains moderate load for hours to find leaks. Spike applies a sudden sharp increase, which models a push notification campaign.
Where does LoadRunner still fit best?
Systems with protocol breadth beyond HTTP, such as SAP, Citrix, and mainframe terminal emulation. Web-focused alternatives thin out quickly once an unusual protocol is involved.
What does load testing fail to measure?
Client-side experience. Rendering cost after the response arrives, device variation, real network conditions, and client resource contention such as thermal throttling all stay invisible to a load generator.
How should load testing and device testing be combined?
Establish backend capacity first, then measure client behaviour on real devices while the backend sits under realistic load rather than idle, then test the combination at spike conditions.