
Blog
How Do You Test Mobile App Performance Properly?
Lab benchmarks and field metrics measure different things, and most teams run one and assume it covers the other. The thresholds and the gap.
Yuvan Sundrani · 21 min read
autosana.ai

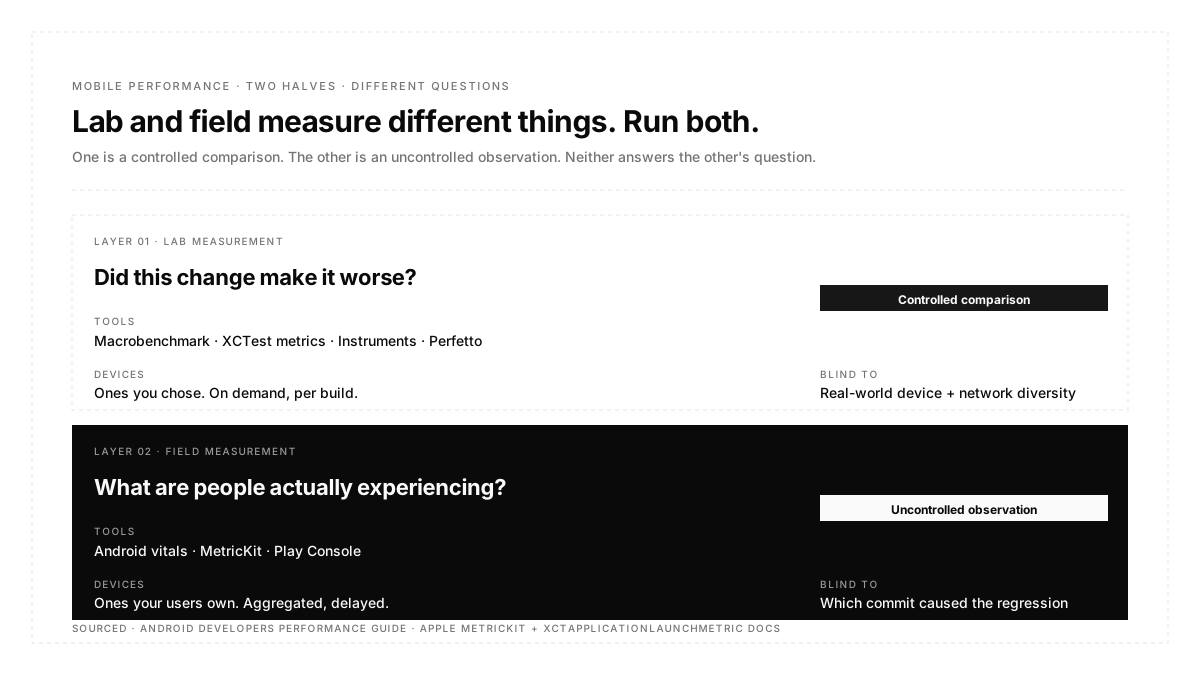
Mobile performance testing has two halves that answer different questions. Lab measurement, using Macrobenchmark on Android and XCTest metrics on iOS, gives you controlled comparison between builds on hardware you control. Field measurement, using Android vitals and MetricKit, tells you what real users on real devices actually experience. Most teams run one and quietly assume it covers the other.
It does not. A lab benchmark cannot tell you your app is being terminated for memory pressure on three-year-old hardware in a market you do not test in. Field data cannot tell you which of last week's four commits caused a regression. You need both, and the numbers that define acceptable are published by both platforms.
The most common mistake in mobile performance work is not measuring the wrong thing. It is measuring the right thing in the wrong place and then trusting the number.
A team profiles startup on a flagship device plugged into a laptop, sees 900 milliseconds, and concludes startup is fine. Meanwhile,Meanwhile a meaningful share of their users are on hardware three generations older with a cold cache and thermal throttling, and their real experience is four seconds. The lab number was accurate. It was also irrelevant to the question being asked.
The reverse failure is just as common. A team watches field dashboards, sees the startup degrade over a quarter, and has no idea which change caused it, because field data aggregates across builds and devices and arrives days late.
So the structure of this post follows the structure of the problem: what the lab is for, what the field is for, the published thresholds that define acceptable in each, and how to stop your measurement environment from lying to you.
Mobile app performance testing measures how an app behaves under real conditions rather than whether it produces correct results. Four dimensions cover almost everything worth tracking: how fast it starts, how smoothly it renders, how much memory and CPU it consumes, and how it degrades on constrained hardware or networks.
It is distinct from load testing, which targets your backend under concurrency. Both matter, but a mobile performance problem is usually a client problem, and a backend that responds in 80 milliseconds will not save an app that spends three seconds in its own initialisation before the first request fires.
| Lab Measurement | Field Measurement | |
|---|---|---|
| Tools | Macrobenchmark, XCTest metrics, Instruments, Perfetto | Android vitals, MetricKit, Play Console |
| Devices | Ones you chose | Ones your users own |
| Timing | On demand, per build | Aggregated, delayed |
| Answers | Did this change make it worse? | What are people actually experiencing? |
| Blind To | Real-world device and network diversity | Which commit caused it |
The division is not a matter of preference. Lab measurement is a controlled comparison, so its value comes from holding everything constant and changing one thing. Field measurement is an uncontrolled observation, so its value comes from including all the variance you cannot reproduce.
Use the lab to catch regressions before release and the field to find out what you never thought to test.
Both platforms publish thresholds, and on Android there are two distinct sets that get conflated constantly.
Android vitals flags startup as excessive at these points:
| Start Type | Excessive At | What It Means |
|---|---|---|
| Cold | 5s or longer | Process does not exist, everything loads fresh |
| Warm | 2s or longer | Process alive, activity recreated |
| Hot | 1.5s or longer | Resident, brought to foreground |
Those are the failure bars. Google's own performance guidance sets the target roughly ten times tighter: cold start under 500 milliseconds, warm under 200, hot under 150. A team that treats the vitals threshold as a goal is aiming at ten times slower than Google's recommendation.
The same guidance adds a criterion almost nobody measures, and it is the most useful one on the list. P95 and P99 startup latency should sit very close to the median. A wide tail is a signal in itself, because it usually indicates lock contention or unnecessary I/O on the startup critical path rather than uniform slowness. An app with a 600-millisecond median and a four-second P99 has a specific, findable problem. An app with a uniform 1.2 seconds has a different one.
For rendering, the budget is arithmetic. At 60 Hz a frame must be produced within 16.7 milliseconds, and jank is what happens when it is not. Google's guidance recommends targeting 90 Hz, since many newer devices operate at 90 Hz during interactions such as scrolling, and some support 120 Hz, which tightens the budget further.
On the stability side, Play's overall bad behaviour thresholds are a 1.09% user-perceived crash rate and a 0.47% user-perceived ANR rate, with a per-phone-model threshold of 8% for both. Exceeding them affects discoverability, which makes these numbers commercial rather than merely technical.
Startup is the metric most worth getting right, because it gates every session and because both platforms measure it for you in the field whether you look or not.
On Android, time to initial display is the framework's own metric, and it is reported automatically for every app with no instrumentation required. It measures the time to render the first frame, which includes process initialisation on a cold start, activity creation, and the first draw. If your first frame is a loading spinner, TTID says the spinner appeared quickly and nothing about when the user could actually do anything. That is what reportFullyDrawn exists for: calling it when the app is genuinely usable produces time to full display, which is the honest number for a content-driven app.
On iOS, the lab equivalent is a performance test built on XCTApplicationLaunchMetric, which records launch duration across repeated iterations. Wrapping a launch in a measure block with an iteration count of ten gives an average rather than a single noisy sample, and once a baseline is recorded the test fails only on a significant regression rather than on ordinary variance. The related metrics in the same family cover CPU, memory, and signpost intervals for custom code sections.
In the field on iOS, MetricKit is the counterpart to Android vitals and is considerably less used than it should be. Available from iOS 13, it delivers aggregated payloads covering roughly the previous 24 hours to a subscriber object, carrying launch, CPU, memory, disk I/O, and network metrics. Values arrive as histograms rather than single numbers, which means you get the distribution rather than an average, and distribution is what you need when the tail is the problem.
One caution when setting this up: Xcode can simulate MetricKit payloads for development, but the option is disabled on the simulator, so real collection requires a real device.
This deserves its own section because it is the single largest blind spot in most mobile performance monitoring.
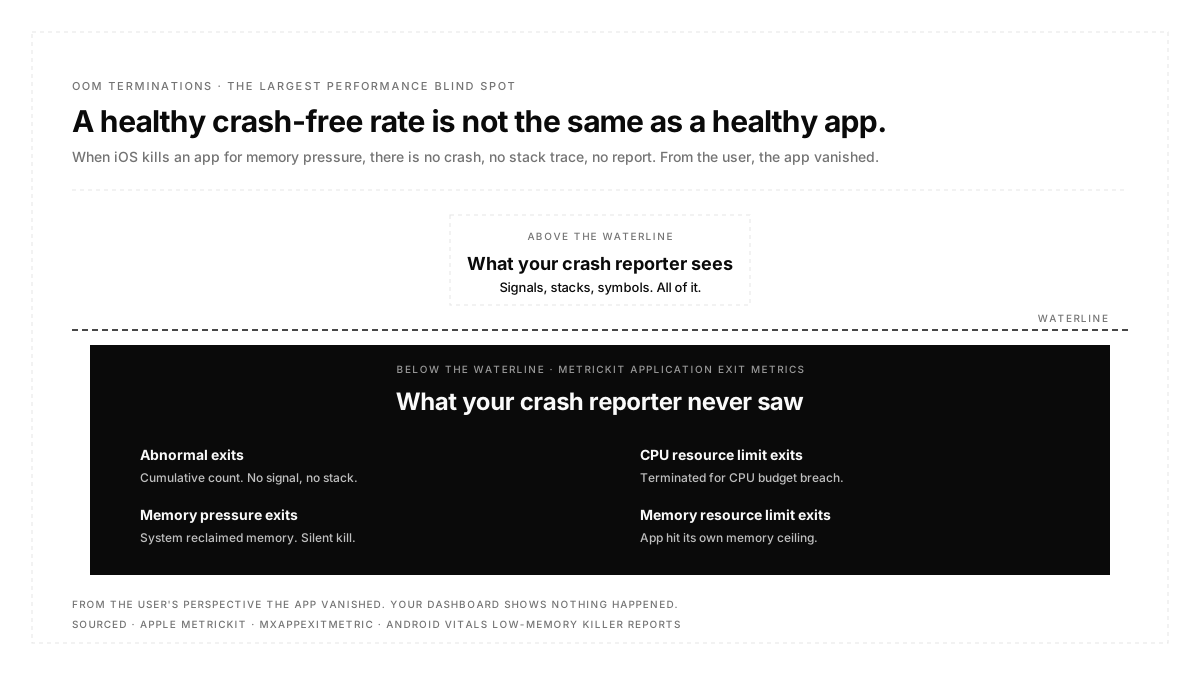
When iOS terminates an app for exceeding a memory limit, that is not a crash. There is no signal, no stack trace, and typically no report from a conventional crash reporting SDK. From the user's perspective the app vanished. From your dashboard's perspective nothing happened, and your crash-free rate stays reassuring.
MetricKit's application exit metrics close that gap. The background exit data carries separate cumulative counts for abnormal exits, exits caused by hitting the CPU resource limit, exits caused by memory pressure, and exits caused by hitting the memory resource limit. Those last two are the out-of-memory terminations, and tracking them is the only reliable way to see a class of failure that is invisible everywhere else.
Android has an analogous problem with low memory killer terminations, which vitals reports separately from crashes for the same reason.
If you take one thing from this post, take this: a healthy crash-free rate does not mean your app is not being killed.
A performance number from a badly configured environment is worse than no number, because people act on it. Google's own performance documentation is unusually direct about the setup requirements.
Never measure performance on a debug build. Debug variants have severe performance impact, so the numbers describe an application your users will never run. For devices on Android 10 (API level 29) and higher, the correct approach is to make a release build profileable through the manifest rather than to profile the debug variant.
Use your production code shrinking configuration. Depending on what the app pulls in, shrinking can substantially change performance. One caveat worth knowing: some ProGuard configurations strip tracepoints, so a configuration used for measurement may need those rules removed.
Control the compilation state. Compiling on device to a known state removes a large source of variance. The speed mode compiles methods completely; speed-profile compiles according to a profile of code paths collected during use and matches production more closely, at the cost of needing a warm-up. Both reduce interpreted execution from dex and the background JIT compilation that interferes with measurement.
Do not lock clocks for user-experience tests. On rooted devices a lock-clocks script fixes CPU frequency, disables small cores, and disables thermal throttling, which is valuable for microbenchmarks and actively wrong for app launch and jank testing, where thermal behaviour is part of what you are measuring.
Keep tracing proportionate. Custom trace sections cost roughly five microseconds each, so instrumenting every method distorts the thing you are measuring. Tracing chunks of work above 0.1 milliseconds gives useful signal without meaningful overhead.
Compare like with like. Run A/B comparisons on the same device and the same OS version, since performance varies significantly even across units of the same model.
Trampoline activities. In a trace, one activity start immediately followed by another with no frames drawn in between means an activity exists only to launch another one, and it is extending startup for nothing. It shows up in both notification and normal launch paths. Note that apps targeting Android 12 or higher cannot start activities from services or broadcast receivers used as trampolines, so some of these have been forced out already.
Allocation-driven garbage collection. Garbage collection every ten seconds during a long-running operation indicates the app is allocating steadily and unnecessarily. The modern guidance is not to eliminate allocations reflexively, since the runtime handles temporary objects efficiently and unmaintainable code is a worse outcome, but hotspots inside inner loops are worth finding. The payoff is measurable in a specific way: longer intervals between collections, and improvement in P99 jank in particular, because collection causes CPU contention that defers rendering work.
Performance belongs in the pipeline, but not the same way functional tests do, because performance measurements are noisy and a single slow run is not a regression.
Two limitations to hold in mind on the middle tier. iOS figures from that capture are measured from the simulator, so they are useful for comparing builds and catching regressions rather than as absolute values, and iOS performance monitoring is not available for local CLI runs. Absolute iOS numbers need real hardware.
For web, the same capture covers JS heap, browser CPU, Core Web Vitals, page timing, and runtime health, with thresholds following Google's recommendations: good is LCP at or under 2.5 seconds, CLS at or under 0.1, and INP at or under 200 milliseconds.
Measure on the hardware your users have, not the hardware your team has. Pick devices from analytics, and include at least one from the low end of your install base.
Set baselines and fail on regression, not on absolute value. Absolute thresholds vary by device. A build being 30% slower than the last one is a defect regardless of the number.
Instrument time to full display, not just first frame. If your first frame is a spinner, the automatic metric flatters you.
Track exit reasons alongside crashes. Memory terminations do not appear in crash reporting and are frequently the larger problem.
Watch the tail, not the average. P95 and P99 close to the median is a stated goal, and a wide gap points at a specific cause rather than general slowness.
Group performance journeys as their own suite so they can run on a different cadence from functional tests, since they need repetition and stable conditions that a fast feedback tier cannot provide.
Performance work goes wrong when a single number gets asked to answer two different questions. Lab measurement exists to tell you whether a change made things worse, which requires holding everything else constant. Field measurement exists to tell you what people are actually experiencing, which requires including all the variance you cannot reproduce. Run both, aim at the targets rather than the failure thresholds, watch the tail as closely as the median, and check your exit reasons, because the terminations that never reach your crash reporter are the ones your users notice most.
Google's guidance is cold start under 500 milliseconds, warm under 200, and hot under 150. Android vitals only flags startup as excessive at five, two, and 1.5 seconds respectively, so the failure bar is roughly ten times looser than the target.
Time to initial display measures the first rendered frame and is reported automatically. Time to full display measures when the app is actually usable and requires you to call reportFullyDrawn. If your first frame is a loading state, only the second number is honest.
For relative comparison between builds, yes. For absolute values, no, because virtual devices differ from real hardware in GPU behaviour, thermal characteristics, and storage speed. Regression detection works on virtual devices; acceptance against a threshold does not.
Compilation state, thermal throttling, background work, and cache warmth all vary. Fix the compilation state, run multiple iterations, and compare on the same device and OS version rather than across units.
No. They need repetition and stable conditions, both of which cost time. Release candidates plus a nightly run is the usual cadence, with lightweight metric collection alongside the functional suite in between.
On iOS, through MetricKit's application exit metrics, which count memory pressure and memory resource limit exits separately from other exits. These do not appear in conventional crash reporting because the app is terminated rather than crashing.
No. Load testing targets your backend under concurrent traffic. Mobile performance testing targets the client: startup, rendering, memory, and CPU on the device.
At 60Hz the frame budget is 16.7 milliseconds. Google recommends targeting 90Hz because many current devices run at 90Hz during interactions such as scrolling, and some go to 120Hz.