
Continuous Build Tools: Where Mobile Build Minutes Actually Go
Continuous build tools decide how fast feedback arrives. Where mobile build minutes go, the three levers that recover them, and what to measure before changing anything.
Yuvan Sundrani · 9 min read
autosana.ai
TL;DR
- Continuous build tools are the build systems that compile your code and produce artefacts: Gradle and Bazel on Android, Xcode and its build system on iOS, plus the caching layers around them.
- Build time is the hidden tax on every test run. An 11-minute cold Gradle build caps how often anyone is willing to exercise the suite.
- Three levers return the most: a working remote build cache, correct incremental build configuration, and module boundaries that limit what a change invalidates.
- Autosana accepts build artefacts from whichever build system produces them, so compile-time work and test execution stay independent concerns.
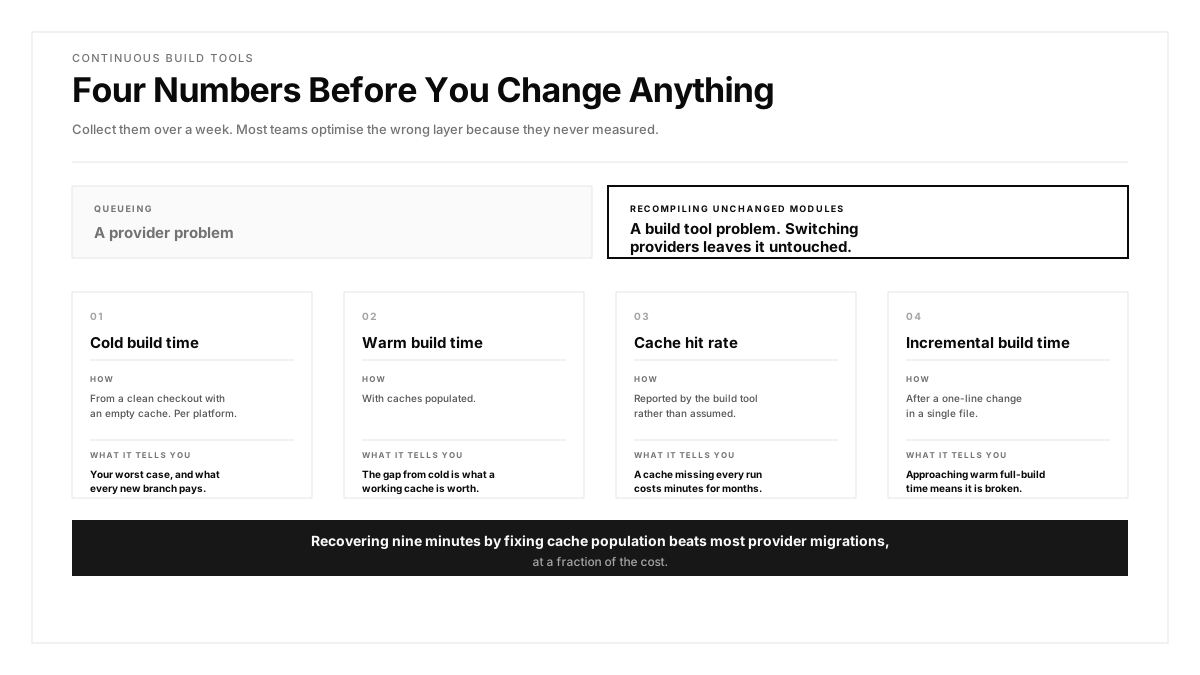
A Gradle build on a cold cache takes around 11 minutes. The same build with a warm remote cache finishes in under two. That difference is the same code, the same machine, and a configuration detail that usually gets set once and then goes unexamined.
Continuous build tools decide how long the gap is between pushing a commit and learning anything about it. Test tooling gets blamed for slow feedback far more often than it deserves, because the compile step sits in front of it.
This guide covers where mobile build minutes actually go, the three levers that recover them, and how to measure your continuous build tools before changing anything.
The Red Hat CI/CD overview and GitHub Actions documentation both treat the build step as distinct from orchestration, which is the separation this guide rests on.
What Counts as a Continuous Build Tool
Continuous build tools are the systems that turn source into artefacts, run repeatedly and automatically as part of your pipeline.
Among continuous build tools on Android that is primarily Gradle, with Bazel used by larger codebases that have outgrown it. On iOS it is the Xcode build system, driven by xcodebuild in automation, with Bazel again appearing at scale.
Continuous build tools sit beneath your CI provider rather than beside it. The provider schedules and orchestrates; the build tool does the compiling. Conflating them is why teams change provider hoping for faster builds and find the same minutes consumed somewhere else.
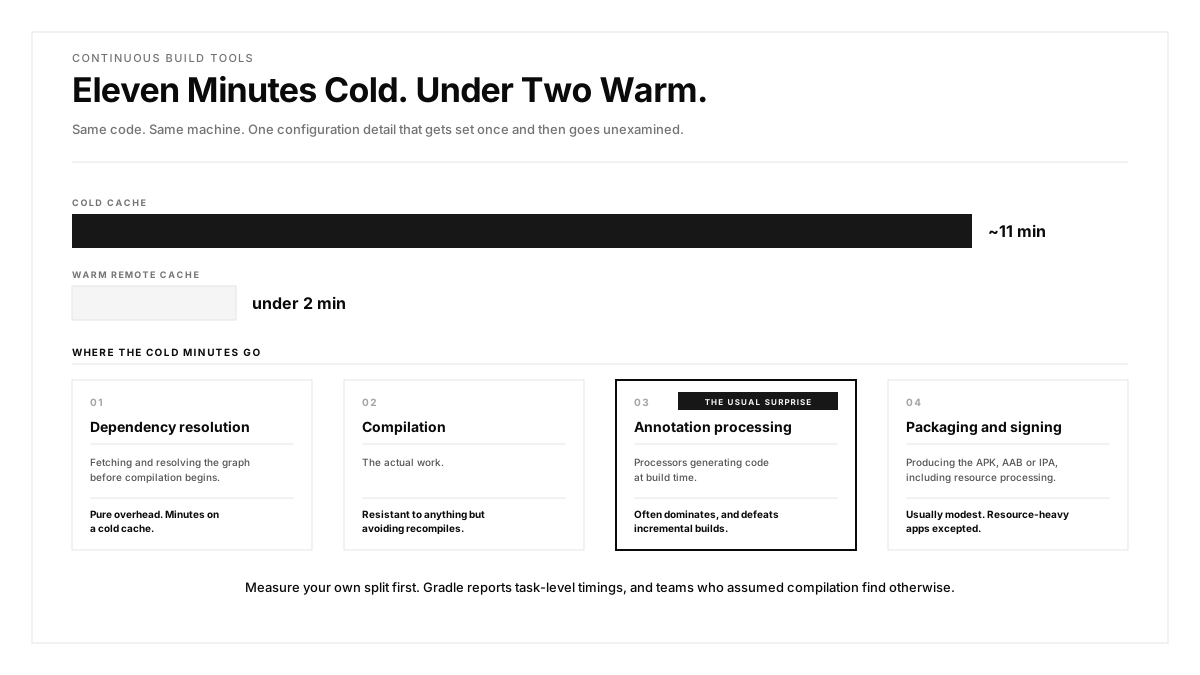
The distinction matters for diagnosis. A slow pipeline caused by queueing is a provider problem. A slow pipeline caused by recompiling unchanged modules is a build tool configuration problem, and switching providers leaves it untouched.
Where the Minutes Go
Four categories account for most of the time continuous build tools spend on a mobile project.
Dependency resolution. Fetching and resolving the dependency graph before compilation begins. On a cold cache this alone can run minutes, and it is pure overhead.
Compilation. The actual work, and the part most resistant to optimisation beyond avoiding unnecessary recompiles.
Annotation processing and code generation. On Android, processors that generate code at build time often dominate, and they frequently defeat incremental builds by invalidating more than they should.
Packaging and signing. Producing the final APK, AAB, or IPA, including resource processing and signing. Usually modest, with resource-heavy apps the exception.
Measure your own split before optimising any of your continuous build tools. Gradle reports task-level timings, and the result commonly surprises teams who assumed compilation was the problem when annotation processing was.
How Much Can a Remote Build Cache Recover?
Most continuous build tools support a build cache storing task outputs so identical inputs skip the work entirely. Local caches help one machine; remote caches share results across the whole team and every CI run.
Gradle's build cache documentation covers the mechanics. Two configuration mistakes make it useless in practice.
The first is a cache that stays unpopulated from CI. Where only developers write to it, CI runs start cold every time, which is the opposite of what you want since CI runs the same build far more often.
The second is non-deterministic task inputs. A task embedding a timestamp or an absolute path produces a different cache key on every run, so it always misses. Gradle reports which tasks are cacheable, and auditing that list is worth an afternoon.
Check your actual hit rate rather than assuming. A cache configured and missing on every run is a silent multi-minute cost that can persist for months without anyone noticing.
How Do You Tell Whether Incremental Builds Are Working?
Continuous build tools support incremental builds that recompile only what changed. They work until something invalidates the whole graph.
The usual culprits are annotation processors that lack incremental support, overly broad dependency declarations where a module depends on far more than it uses, and build logic reading mutable state such as the current time or environment variables.
The diagnostic is straightforward: change one line in one file, rebuild, and watch how many tasks execute. Where the answer is most of them, incrementality is broken and the cause is in that list.
This is worth checking after any dependency upgrade, since a processor losing incremental support between versions is a common and silent regression.
How Do Module Boundaries Affect Build Time?
Module structure decides blast radius. A change to a module that half your codebase depends on invalidates half your codebase.
Three patterns help. Keep frequently changed code in leaf modules rather than shared ones. Depend on API modules rather than implementation modules, so an implementation change stays local. And split modules that have grown large enough that most changes touch them.
The trade is real: more modules means more configuration overhead and a longer configuration phase. Past a certain count, Gradle spends meaningful time just working out what to build. Measure rather than assuming more modules is better.
How Does Build Time Affect Test Feedback?
The connection between continuous build tools and test feedback is direct. Build time sits in front of every test run, so it caps how often the suite can realistically execute.
A pipeline where the build takes 20 minutes and the tests take 5 is a build problem presenting as a testing problem. Teams in that position commonly cut test scope, which is the wrong lever and makes the product worse while leaving the actual cost untouched.
Three practices keep the two independent.
Build once, test many times. Produce the artefact in a single job and reuse it across every test job rather than rebuilding per suite.
Separate the tiers. Fast checks run against a quick build. Regression suites and cross-device mobile test automation run against an artefact produced once, on a schedule that tolerates a longer build.
Keep the artefact addressable. Where a test run can be pointed at a specific build by identifier, smoke tests and API checks can run in parallel against the same artefact rather than queueing behind separate builds.
Our app build guide covers producing artefacts suitable for cloud execution, and apps manages them per platform.
What Should You Measure Before Changing Anything?
Four numbers, collected over a week, tell you where to spend effort on your continuous build tools.
Cold build time per platform, from a clean checkout with an empty cache. This is your worst case and what every new branch pays where caching is misconfigured.
Warm build time, with caches populated. The gap between this and cold is what a working cache is worth.
Cache hit rate, reported by the build tool rather than assumed.
Incremental build time after a one-line change. Where this approaches warm full-build time, incrementality is broken.
Collect these before evaluating any change. A team that recovers nine minutes by fixing cache population has gained more than most provider migrations deliver, at a fraction of the cost. Performance testing of the application is a separate discipline, and build performance deserves the same measured treatment.
How Autosana Fits
We stay out of your build. Whichever continuous build tools produce the artefact, we take it from there.
Our app build guide documents what a cloud-executable build needs, and apps stores artefacts per platform so a single build feeds many test runs.
Our API for CI accepts an artefact and triggers a run against it, which supports the build-once-test-many pattern directly. CI/CD integration and GitHub integration cover the common paths.
Because test execution happens on our real-device infrastructure rather than on your build runners, widening the device matrix costs zero build minutes. That separation is what keeps a slow build from forcing a narrow test matrix.
Conclusion
Change one line in one file, rebuild, and count how many tasks execute.
Where the answer is most of them, your incremental build is broken, and that single finding usually explains more pipeline time than any test suite does. The cause is almost always a non-incremental annotation processor or a module everything depends on.
Then check your cache hit rate from CI specifically rather than from a developer machine. A cache populated only by developers leaves every CI run starting cold, which is the one place it matters most.
.png)
FAQ
What are continuous build tools?
Continuous build tools are the systems that compile source into artefacts repeatedly as part of a pipeline. On Android that means Gradle and Bazel; on iOS the Xcode build system, plus the caching layers around all of them.
How do continuous build tools differ from CI providers?
The provider schedules and orchestrates jobs. The build tool does the compiling. A pipeline slowed by queueing is a provider problem; one slowed by recompiling unchanged modules is a build configuration problem.
Where does mobile build time actually go?
Dependency resolution, compilation, annotation processing and code generation, then packaging and signing. Annotation processing commonly dominates on Android and is frequently assumed to be compilation.
What makes a remote build cache useless?
Two things: a cache that only developers populate, leaving every CI run cold, and tasks with non-deterministic inputs such as timestamps or absolute paths, which produce a fresh cache key on every run.
How do you tell whether incremental builds are working?
Change one line in one file and rebuild. Where most tasks execute, incrementality is broken. The usual causes are non-incremental annotation processors or over-broad dependency declarations.
How do module boundaries affect build time?
They decide blast radius. A change to a widely depended-on module invalidates everything downstream. Keep frequently changed code in leaf modules and depend on API modules rather than implementations.
How does build time affect testing?
It sits in front of every test run and caps how often the suite executes. Teams facing a 20-minute build and a 5-minute suite often cut test scope, which addresses the wrong cost.
What should you measure before optimising continuous build tools?
Cold build time per platform, warm build time, cache hit rate reported by the tool, and incremental build time after a one-line change. Collect all four over a week before changing anything.